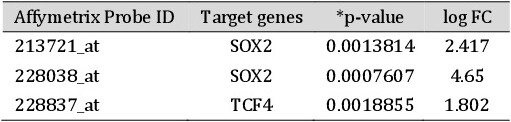
Table 3. Expression levels of SOX2 and TCF4 in a separate subset of typical (n=6) vs. atypical (n=7) lung carcinoids. Results were derived from GEO2R [20] analysis of the dataset GSE35679 [21]. Note that SOX2 over-expression was detected by two different probes in the Affymetrix array platform (U133 Plus 2.0) used for gene expression analysis. *Corrected p-values: Benjamini Hochberg method